Staff Reporters
Jun 8, 2018

Top 1000 infographics: Rising, falling and sector-leading brands

Your handy graphic guide to the biggest movers within the top 100 this year, plus Asia's top 10 social media and smartphone brands, and the top five brands in 10 key categories.

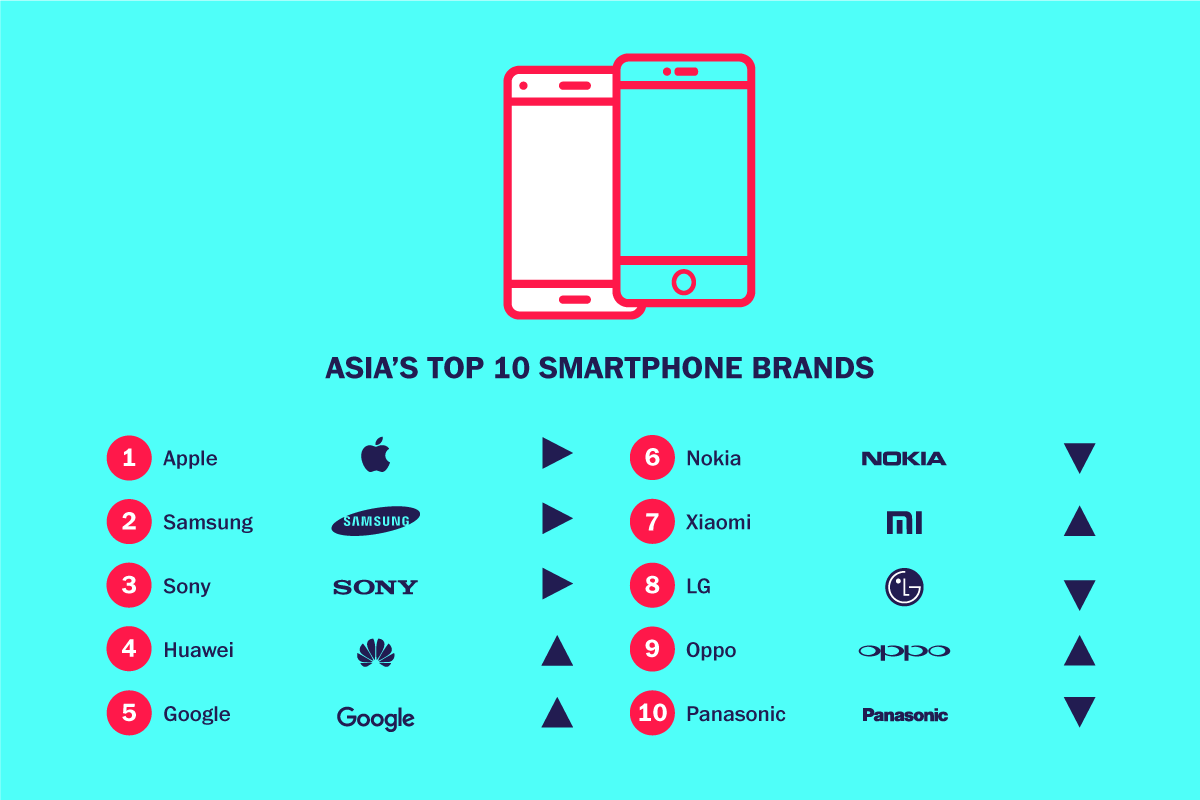
Our Top 1000 Brands list is a deep well of data containing numerous fascinating stories and insights. Here we've broken out some key need-to-know information, including the brands that have risen and fallen furthest in the top 100 in the last year, plus the top 10 smartphone and social-media brands in Asia and how far they've moved up and down since 2017. 

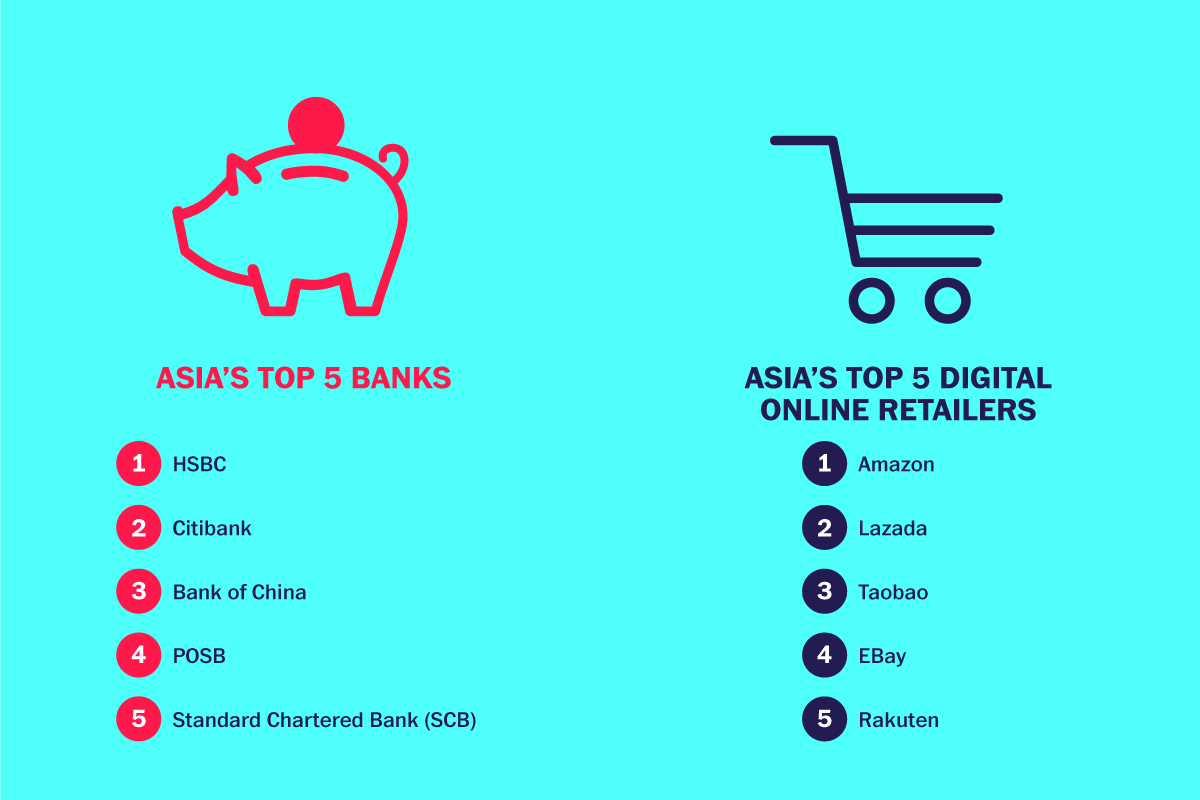
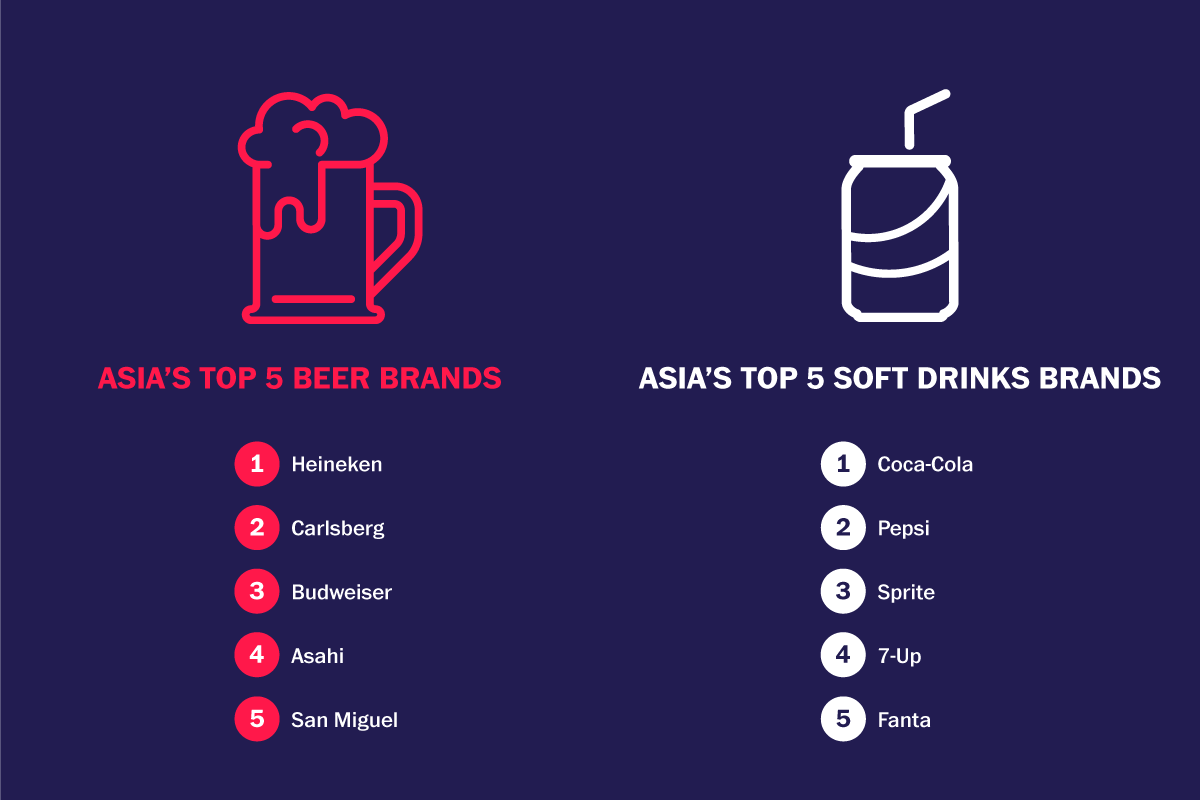
You can also find the top five brands in 10 critical categories: cars, airlines, food, ice cream, beer, soft drinks, banks, online retailers, luxury brands and cosmetic brands. 

All the data come from our Asia's Top 1000 Brands list, created in association with Nielsen. 

Source:
Campaign Asia

Related Articles

Just Published

3 hours ago

Agency Report Cards 2024: We grade 25 APAC networks

The grades are in for Campaign Asia's 22nd annual evaluation of APAC agency networks. Subscribe to read our detailed analyses.

4 hours ago

Agency Report Card 2024: Havas Creative

Havas's post-split independence will be on trial. Can its ‘Converged’ strategy deliver business growth, and can its leaders address the internal diversity issues?

5 hours ago

PHD wins Bunnings media mandate after competitive pitch

PHD clinches Bunnings’ $50 million media account from Initiative in a fiercely contested multi-agency pitch.

6 hours ago

Marketing budgets hold at 7.7% in 2025: Gartner CMO ...

Gartner's 2025 CMO Spend Survey finds average marketing budgets are at 7.7% of company revenue for a second consecutive year. However, half of CMOs reported budgets of 6% or less.