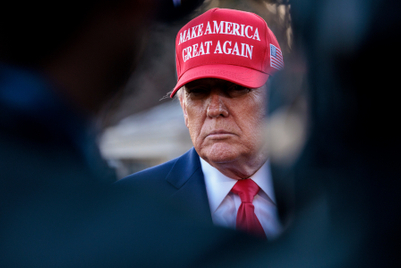
Donald Trump has damaged Chinese consumer sentiment towards buying US property and stocks, travelling to the US and studying in the US.
This is according to a joint study by China Skinny and Findoout, which surveyed 2,000 consumers across China in late February.
The three categories mentioned above were the most negatively impacted out of 15 studied, with net sentiment declines of 17.7 percent, 13.9 percent and 10.0 percent, respectively.
Food and beverage, mother and baby products and beauty products were the next three most affected categories.
China is America’s largest export market after Canada and Mexico, and the fastest growing of its major trading partners.
President Trump has not been entirely negative for American exporters to China. Although overall Chinese consumer sentiment towards US brands has taken a hit since he was elected, America’s soft power provided a distinct advantage for three categories: movies (up 11.8 percent in net sentiment), music (up 5.4 percent) and media (up 3.5 percent).
This indicates that Trump has piqued curiosity among Chinese consumers regarding overall American culture, said Mark Tanner, managing director of China Skinny. “In an obscure way, that could help American brands.”
“Remarkably, the results were consistent across respondents’ city tiers, genders, ages and professions, signalling that Trump is impacting attitudes in every corner of China,” added Bowei Yu, CEO of Findoout.
The joint survey was conducted online between 21 and 23 February, with the respondents evenly split between male and female, with 56 percent living in tier-one and tier-two cities and 70 percent aged betwen 18 and 35.
| Among those respondents who care: | |||||
|
Don't Care |
More |
Neutral |
More |
Net |
|
|
General US Sentiment |
55.6% |
8.1% |
50.7% |
41.2% |
-33.1% |
|
Perception of the following U.S. products and services: |
|||||
|
Investments |
71.2% |
15.8% |
50.7% |
33.5% |
-17.7% |
|
Travel |
63.0% |
12.1% |
61.8% |
26.0% |
-13.9% |
|
Study |
65.9% |
14.7% |
60.7% |
24.6% |
-10.0% |
|
Food & Beverage |
54.5% |
8.9% |
72.7% |
18.4% |
-9.5% |
|
Mother & Baby |
57.9% |
6.9% |
78.2% |
14.9% |
-8.1% |
|
Beauty Products |
57.7% |
8.9% |
77.1% |
14.1% |
-5.2% |
|
Health & Pharma |
56.6% |
9.4% |
76.5% |
14.1% |
-4.6% |
|
Automotive |
50.1% |
9.4% |
77.8% |
12.8% |
-3.4% |
|
US-Branded Cafes |
41.7% |
8.7% |
79.3% |
12.0% |
-3.3% |
|
Electronics |
41.7% |
13.5% |
71.0% |
15.4% |
-1.9% |
|
Fashion & Accessories |
50.5% |
11.0% |
77.2% |
11.8% |
-0.8% |
|
Sport |
54.2% |
13.3% |
74.9% |
11.8% |
1.5% |
|
Media |
51.9% |
13.4% |
64.2% |
9.8% |
3.5% |
|
Music |
45.0% |
13.1% |
79.3% |
7.6% |
5.4% |
|
Movies |
38.0% |
18.2% |
75.4% |
6.4% |
11.8% |


.jpg&h=334&w=500&q=100&v=20250320&c=1)


.png&h=334&w=500&q=100&v=20250320&c=1)


.png&h=334&w=500&q=100&v=20250320&c=1)


.jpg&h=268&w=401&q=100&v=20250320&c=1)


